Project Summary & Skills Used
Our overall goal was to create an OR model to simplify stock investment by giving users a tool that gives users a tool that gives users a reliable model that is easy to use and allocates their funds in a stock portfolio.. The framework we used for our model comes from the Markowitz mean-variance model that was first published in 1952 in the Journal of Finance. Our data was obtained from Python using the yfinance import where we took monthly closing prices of 107 different stocks and generated monthly returns, expected returns, and a covariance matrix. This project directly links to Industrial Engineering and Operations Research, particularly in the area of data-driven decision making. We used OR tools to structure an investment problem, quantify risk and return, and let the solver recommend an optimal portfolio under clear constraints.
Skills used
- Optimization using covariance matrix
- Excel data cleaning and large-scale data handling
- Time weighted Return calculations in excel
- Implementation of binary decision variables for cardinality constraints in portfolio optimization
- AMPL implementation of optimization model
Project Development Process
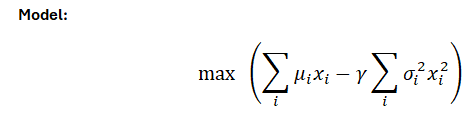
our original goal was to to create a portfolio optimization model that used CVaR and expected return to allocate resources in a stock portfolio (See Below)
During our project proposal Dr. Sullivan referenced the Markowitz model and recommended looking into it, and after reviewing our previous model we realized that the objective function was broken because it failed to keep the integrity of the expected return. From here we shifted gears and began to look into the model and since it fit our overall goal we decided to use it as a framework for our model. The First steps was getting our data in the correct format that the model would need, this includes monthly stock returns, expected return, and a covariance matrix using the monthly returns. After writing our AMPL code for this model our output looked like this
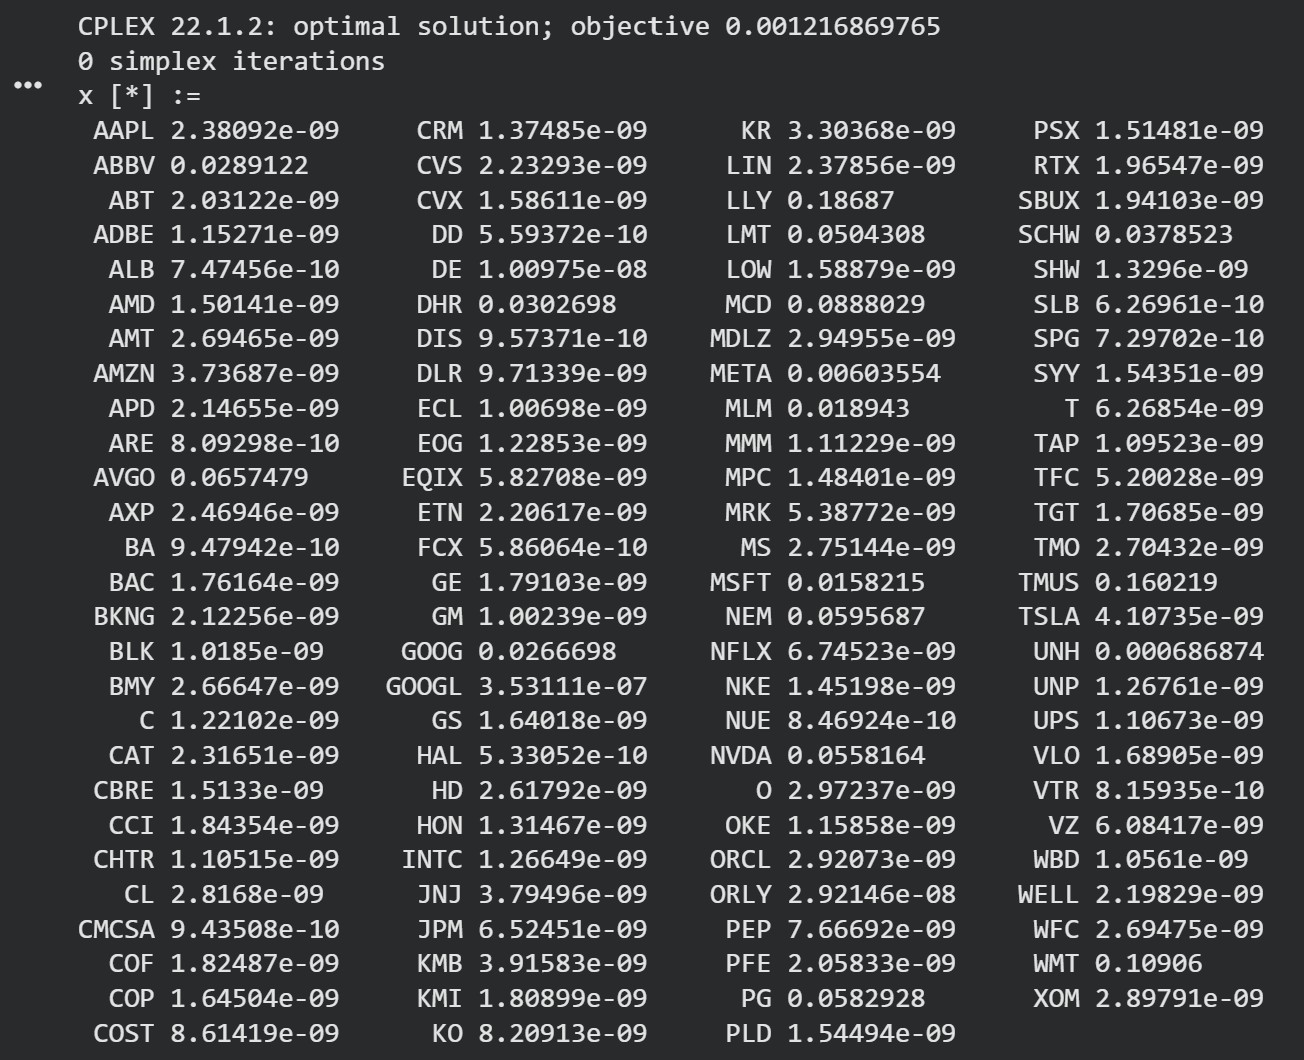
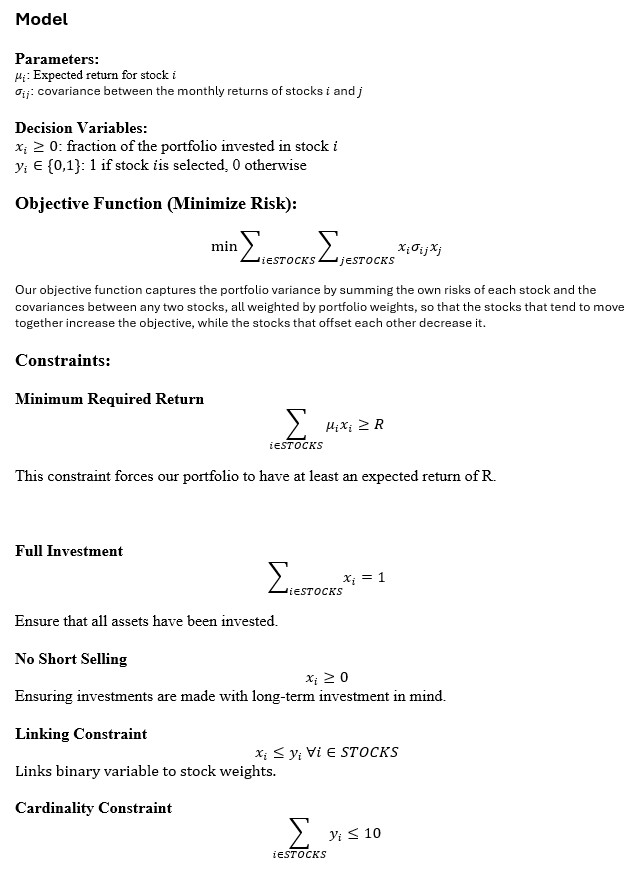
We knew from this output that something had to change, because although it was resulting in the most optimal solution having stocks that call for weights of less than 0.0001 is unrealistic to investors. We did some research and after reviewing Evans and Archer The Journal of Finance we decided to create a cardinality constraint because after testing thousands of portfolios they concluded that around 10 stocks was the optimal point for portfolio investments. While reviewing the Markowitz model we became aware of a dangerous flaw in the way that expected return is calculated, when calculating expected return it simply takes the averages of each months returns and that is what represents expected return. If a stock was to increase for 6 years at a steady pace but has been steady declining for the past 4 years the Markowitz model would see this as a stock that should be invested in because the average results in a positive expected return. To solve this pitfall, we decided to use weighted averages by splitting our data up into three blocks the first block is 48 months, the second is 48 months, and the latest is 24 months, being the most recent data. We wanted the most recent activity of a stocks return to be consideredmuch more, so we assigned the most recent block a weight of 0.6 the second most recent block 0.3 and the oldest block 0.1. An example of this being successfully implemented was stock CHTR, In the oldest block its return rate is 0.19, the second block 0.0083, and the newest block had a return rate of 0.00092. This stock has clearly been on a downward trend, however the Markowitz model still put its expected return to 0.011. After applying the weights to the average, our extended model had a much more accurate representation of the stock with an expected return of 0.008. Our final model looked like this:
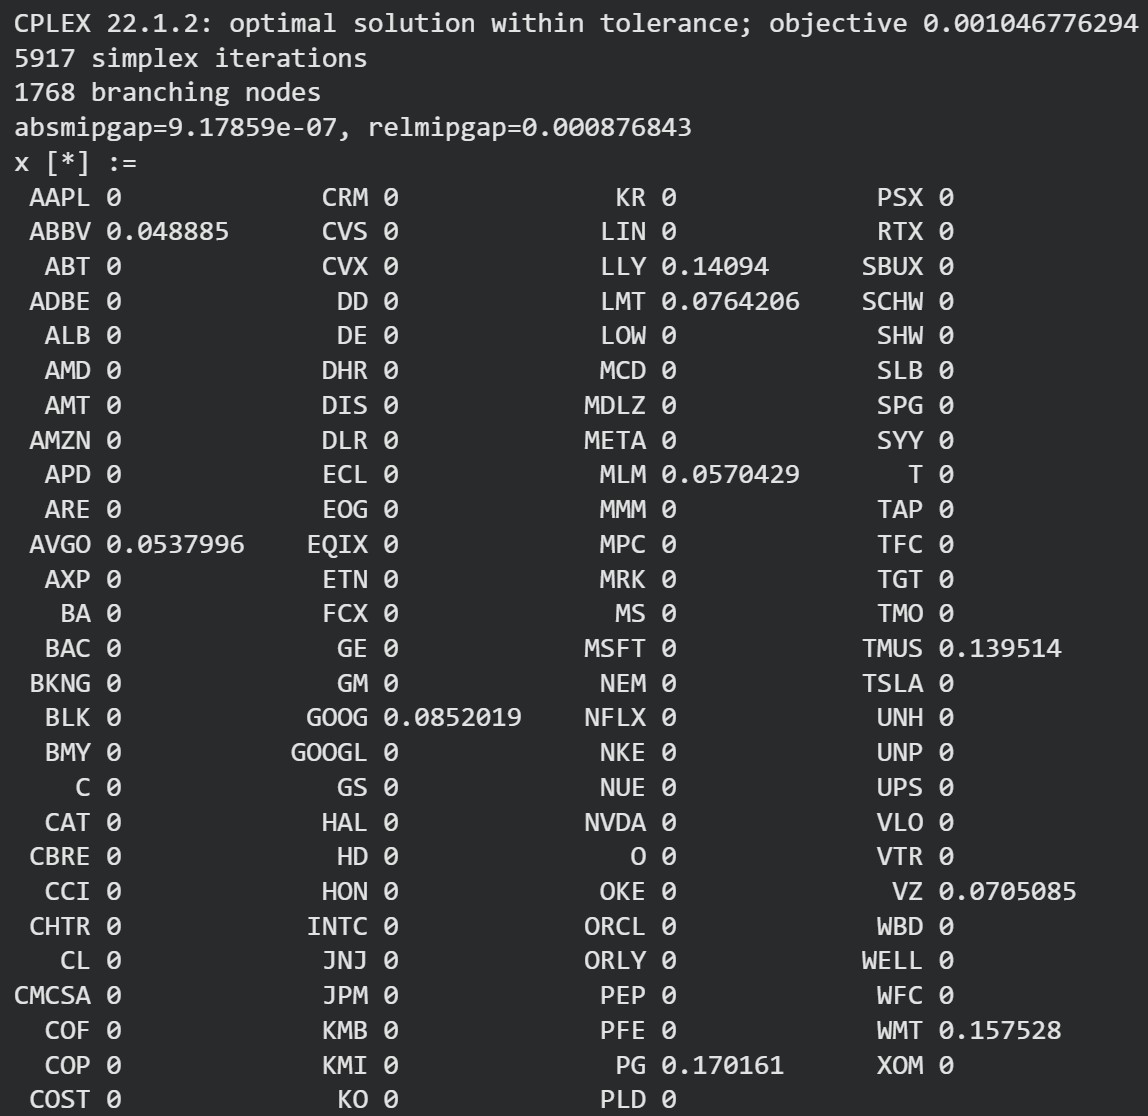
With these changes our new output looked like:
Key Features or Highlights
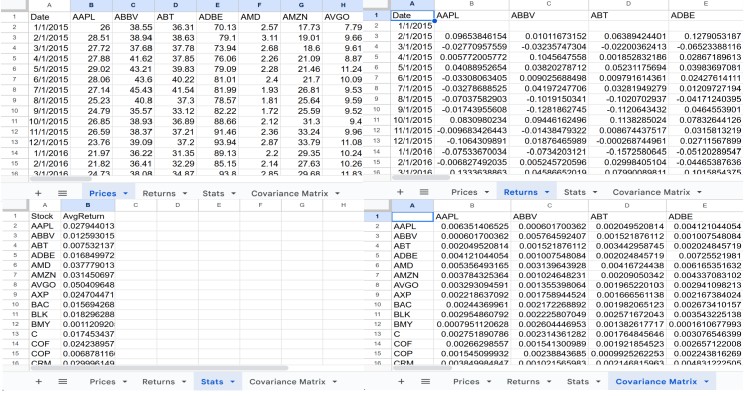
The part of the project that I am most proud of is the way we were able to take raw market data and turn it into something that is applicable in real life by using real engineering problem-solving skills. An image of what our data looks like is shown below:
To get our data to the level that we wanted we had to use skills such as:
- Multi-sheet excel formulas that combine data from several worksheets
- Use of custom time-weighted expected return formula
- Built a return covariance matrix in excel using covariance.s across 107 stocks
I’m proud of this part of our project because we considered how our data would interact with real applications of stock portfolios and built our data to be consistent with these factors.
Reflection
While doing this project i gained experience in data manipulation, AMPL modeling, and financial analysis. My contributions include creating idea, extending the model, data generation, data conversion, AMPL code, and documentation. The most important skill that i believe that I gained it the ability to logically work through a optimization problem and work through effective solutions to problems that arise.
During this project I grew more confident in:
- Using AMPL to solve optimization problems
- handling data sets and using multi-sheet formulas.
- balancing two goals in an optimization model
This project demonstrated how operations research can be directly tied to other non engineering fields such as financial decision-making.